


Business Intelligence and Data Engineering


Service Description
Project overview
Client: Northstar Retail (fictional)
Industry: Retail and E-commerce
Tools: Microsoft Power BI, SQL, Excel
Project type: Business Intelligence & Data Visualization
Data: Fictional sample sales data
Technology Used
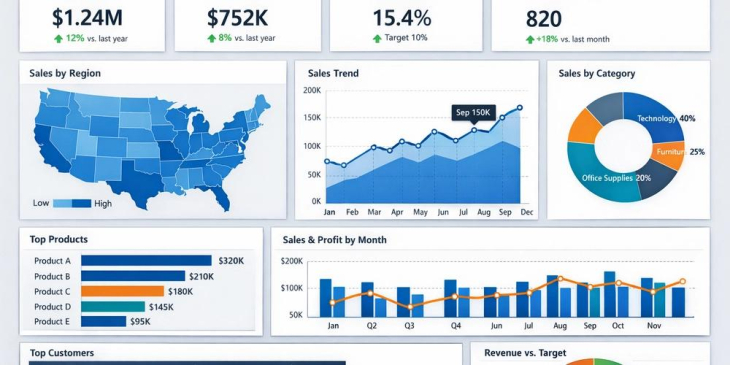
Dashboard features
Feature
Description
Sales overview
Total sales, profit, and order count
Monthly trends
Sales performance over time
Product analysis
Compare sales across product categories
Regional analysis
Identify top-performing regions
Profitability
Analyze profit margins and revenue
Interactive filters
Filter by date, region, and category
Frequently Asked Questions
Project deliverables
Such As
Interactive Power BI dashboard (.pbix)
Cleaned sample dataset in Excel or CSV
Data model and DAX measures
Sales and profitability insights
Dashboard screenshots for your portfolio



Share This Service


