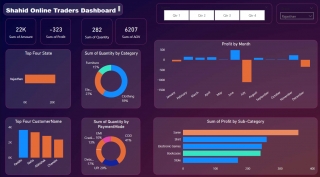

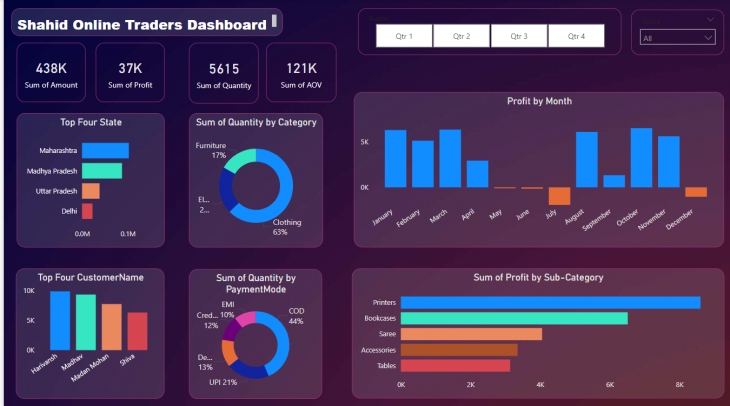
Online Store Dashboard
in 7 days, with 10 revisions

You must sign in to purchase
$50
START DISCUSSION

Service Description
This Online Store Dashboard, created using Power BI, provides a detailed overview of key metrics such as total sales, customer insights, product performance, and regional trends. It includes interactive visuals to track revenue growth, top-performing products, customer demographics, and sales trends over time. The dashboard helps identify high-revenue regions, monitor inventory levels, and analyze customer behavior, enabling data-driven decisions to optimize marketing strategies, improve inventory management, and enhance the overall shopping experience.
Technology Used
PowerBi, Excel
Frequently Asked Questions
Do You Have Any Question?

2
Service(s)
0
Follower(s)
0
Purchase(s)
Category:
Ecommerce Expert
Share This Service