

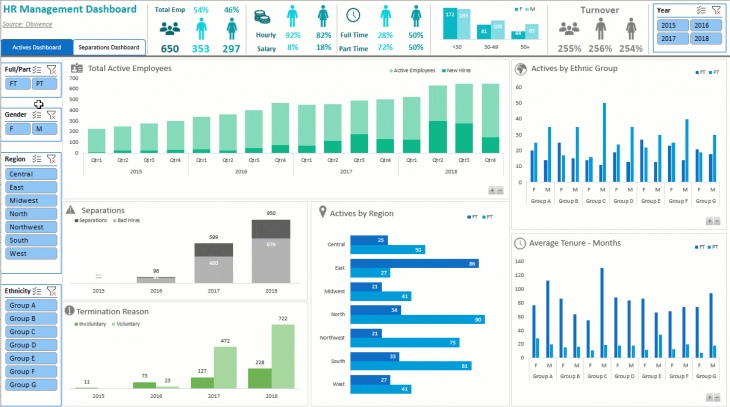
Create graphs,Pivot tables and Dashboard


Service Description
Hey! Hope you are doing great. I am here for my client satisfaction, Kindly message me before placing an order so we can discuss about the project.
I will create amazing dashboards using Power BI, Tableau, Google Sheet, Google Data Studio and Excel.
If you are not sure on which tool to go for. We can provide you FREE consulting on deciding the tool . Tableau, Google Data Studio and Power BI each has its own pros and cons. Depending on the business requirement we can choose what is best for you.
Types:
Highlighted Tables
Pie Charts
Horizontal Bars
Stacked Bars
Side-by-Side bars
Tree Maps
Circle Views
Side-by-Side Circles
Dual Lines
Area Charts (Continuous)
Area Charts (Discrete)
Scatter Plots
Please drop a message - will look forward to solve your analytics need . Also do share the data sources - it can be in the from Excel, CSV etc.
Thanks in advance
Technology Used
Excel, Tableau, Google Data Studio, Microsoft Power BI, Google Sheet.
Frequently Asked Questions
Please contact before placing the order.

Share This Service