
Do Data Analysis and Visualization

Service Description
*** To avoid any misunderstanding, please message me first to discuss your project. If you do that, you will get handsome discount ***
I am an Expert (BI reporting, Power BI, Power Pivot / Power Query and Excel) with graduation in the field of data analytics, reporting and visualization.
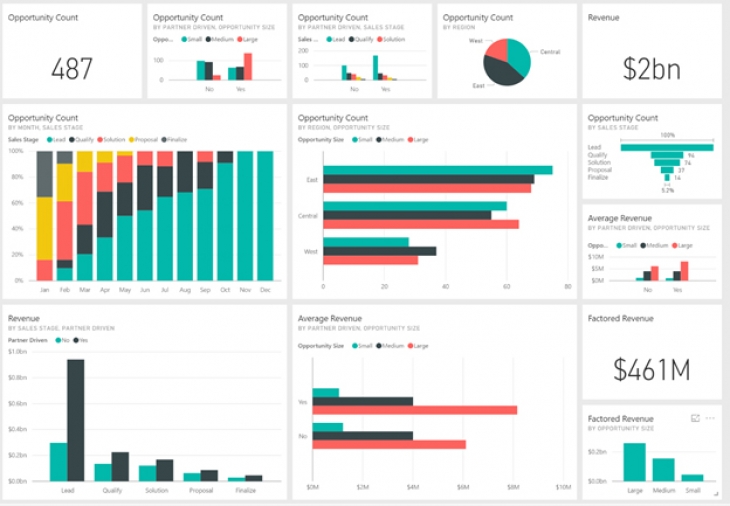
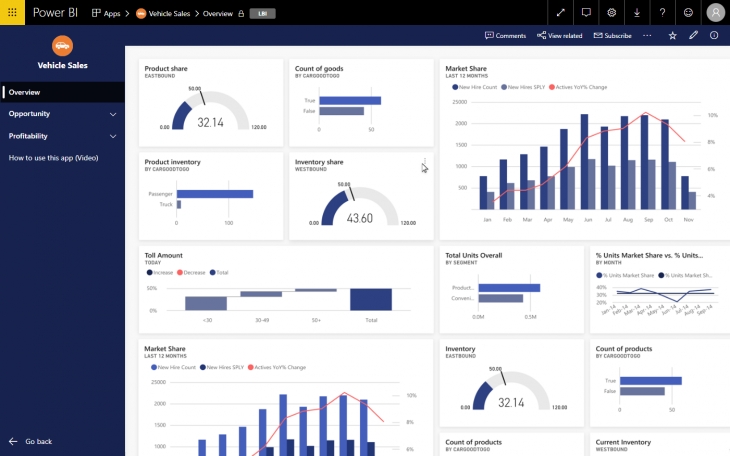
Extensively use Power Pivot and Power View to design, create and build interactive Power BI dashboards with various KPI’s to give deep and accurate insights.
Connect to all type of data sources - Excel / CSV / SQL / MS Access / cloud apps / web pages etc.
Data modelling (relationships), Data cleaning and transformation using Query Editor
Use Power Map to map coordinates and various locations.
Take existing data and get the right conclusions out of it by Business Intelligence Techniques.
Extensively do DAX functions to make your data usable for producing great visuals and reports.
I will attach a Reporting Documentation to each Power BI report explaining what are the metrics used in the report, interpretation of visuals and tips on navigating in Power BI.
Technology Used
PowerBI
IBM Watson Studio
Excel
Frequently Asked Questions
Kindly brief your project and business domain.

Share This Service