

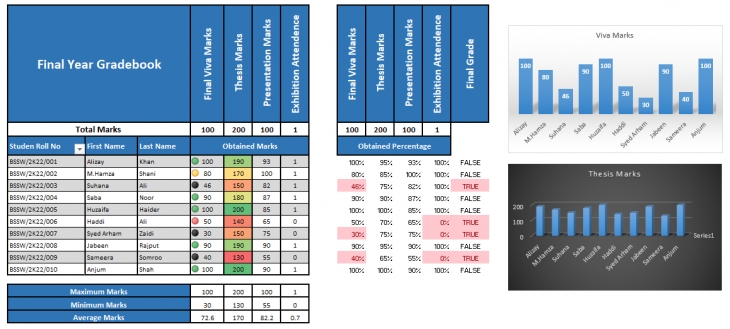
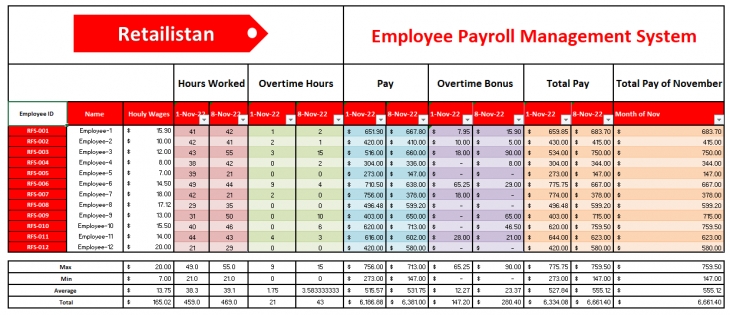
Data Analytics and Data Visualization Using Excel


Service Description
I am a Quality Control Executive by profession with a special interest in Data Visualization using Excel and Power BI. I have 2+ years of work experience in business, personal, and academic data analysis and data visualization. I love to clean and transform raw data into professional excel reports and dashboards that will assist the relevant participants to view the insights and trends hidden behind their valuable data.
My Services include:
• Data Cleaning
• Data Visualization
• Data Filtering
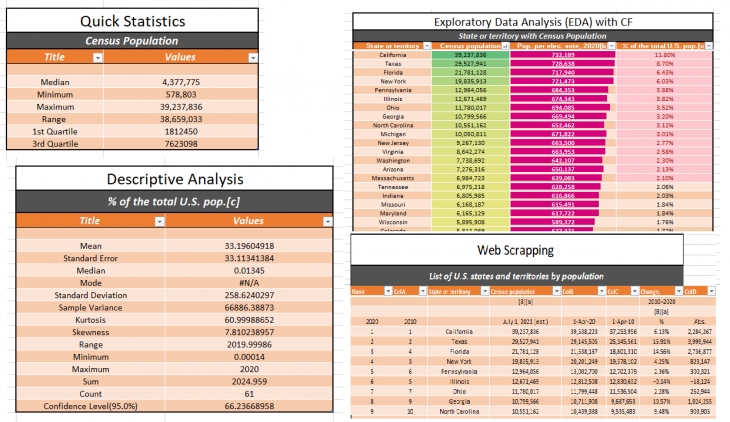
• Conditional Formatting
• Exploratory Data Analysis (EDA)
• Quick Statistical Analysis
• Descriptive Analysis
• Quantitative and Qualitative Analysis
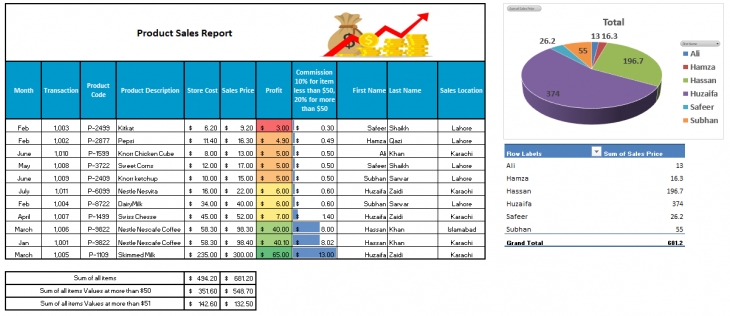
• Formulas (Basic, Financial, VLOOKUP)
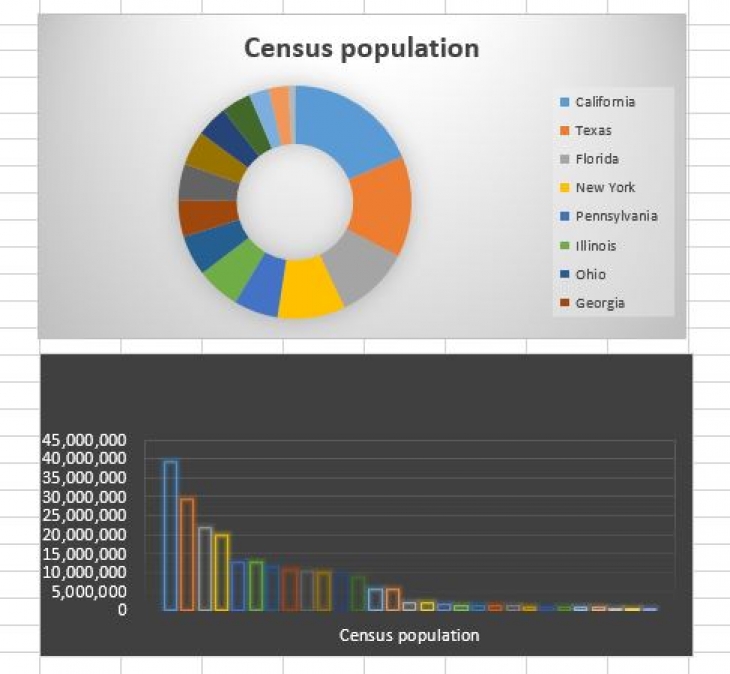
• Histograms, Tables, Charts, and Graphs
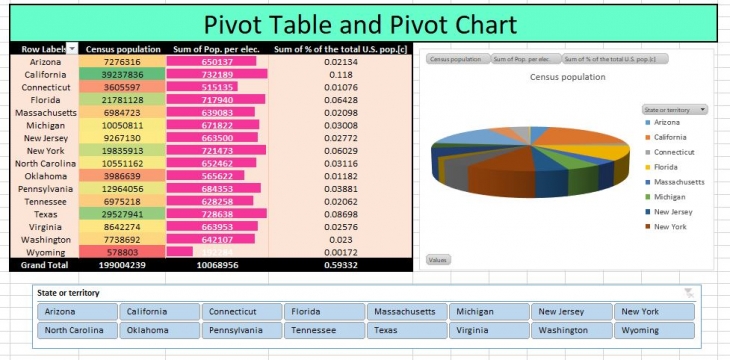
• Pivot Tables
• Pivot Charts
• Interactive Reports
• Interactive Dashboards
• Web Scrapping
Technology Used
Google Sheets
Microsoft Excel
Frequently Asked Questions
1. Do I need to contact you before placing an order?
Ans. Yes please, do contact me with your business requirements.
2. Can you offer me free Sample Excel Tables and Charts?
Ans. Yes, I will offer you free Sample Excel Tables and Charts of your data for better understanding.
3. Can you show us your previous work?
Ans. Of course, send me a message and I will show you the previous works I have done before.

Share This Service